Reports in Mint Service Desk – A Comprehensive Guide to Smarter IT Data Management
What’s a Rich Text element?
The rich text element allows you to create and format headings, paragraphs, blockquotes, images, and video all in one place instead of having to add and format them individually. Just double-click and easily create content.
Static and dynamic content editing
A rich text element can be used with static or dynamic content. For static content, just drop it into any page and begin editing. For dynamic content, add a rich text field to any collection and then connect a rich text element to that field in the settings panel. Voila!
How to customize formatting for each rich text
Headings, paragraphs, blockquotes, figures, images, and figure captions can all be styled after a class is added to the rich text element using the "When inside of" nested selector system.
1 element
2 element
3 element
1 element
2element
3 element
In IT it’s easy to drown in numbers: tickets, queues, assets, contracts, response times, emails… Without context, they’re just noise. Put them into a meaningful report and they become a map your team can follow to move faster and with confidence.
This article is a practical guide to the Reports module in Mint Service Desk. You’ll see what you can report, how to set it up, for whom, and why. In return, you get a tool that’s fast, predictable, and effective in daily work.
What you can report with Mint Service Desk
Live view of tickets: statuses, queues, types, assigned agents, priorities, creation/update dates, etc.
Contracts & SLAs: which contracts are active, where SLA parameters live, and how delivery looks across a given period.
CSV/XLSX export and automatic email delivery.
Generation history of reports — revisit earlier outputs and compare them with new ones.
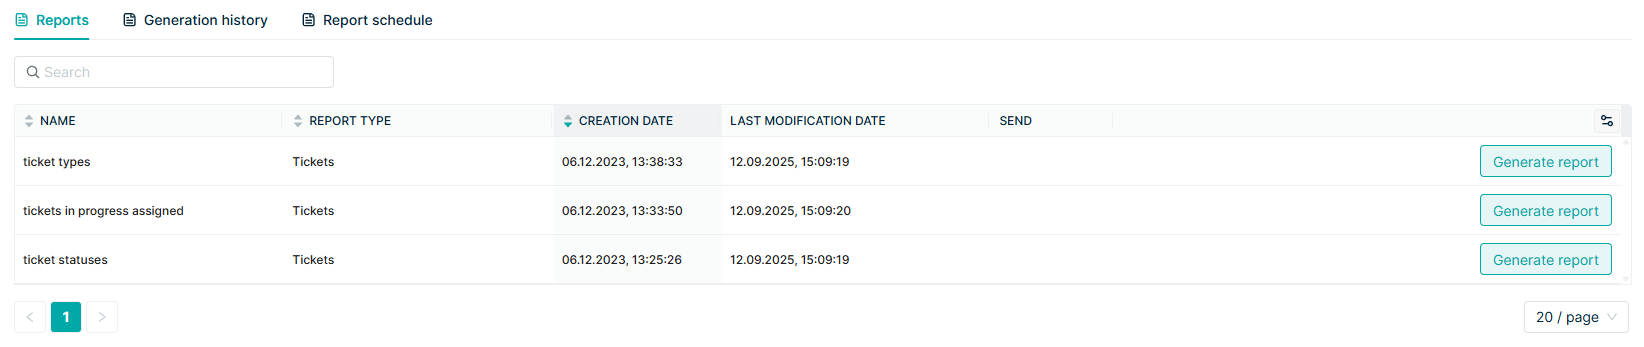
Report types in Mint Service Desk (with practical examples)
Tickets
For day-to-day operations:
How many tickets are waiting in each queue?
Which issue types recur most frequently?
How is agent workload distributed?
Example: Every Monday morning you check the count of open “High” tickets per queue to decide on team reassignments.
Assets
Keeping hardware and licenses clean and current:
Which devices need maintenance/replacement?
Which licenses expire in the next quarter?
Where (which location) do we have the most devices of a given type?
Example: A quarterly report of devices older than four years — your basis for replacement planning and budgeting.
Contracts (SLAs)
Peace of mind in B2B service delivery:
Which contracts are active?
Which renewals are approaching?
How is SLA performance trending in the selected period?
Example: A monthly SLA report for the customer — a transparent basis for prioritization and planning.
SQL Reports (advanced)
When you need a tailor-made view:
For specific customers, services, or attributes,
To align with internal reporting standards.
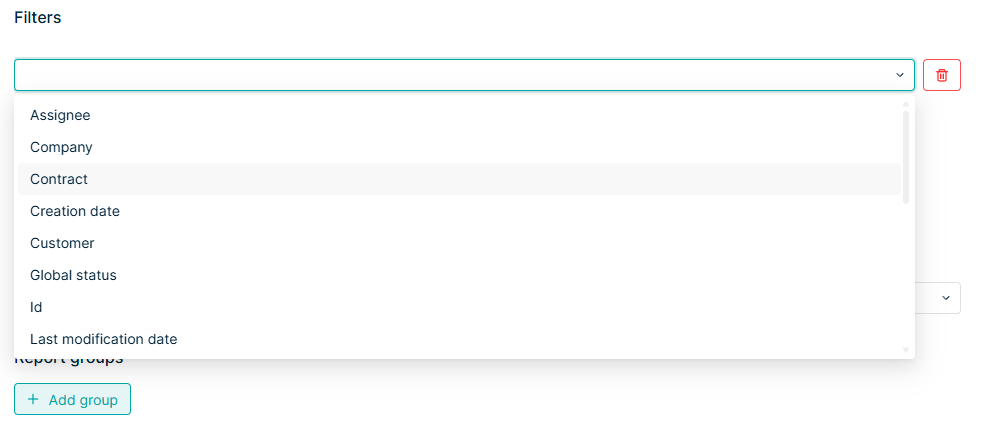
Filters - from noise to a clear answer
Good filters decide whether you get a click-through list or a direct answer. In Mint you’ll filter by, among others:
Time (date ranges),
Status (e.g., only “Open” and “In Progress”),
Queue and ticket type,
Assigned agent or group,
Custom fields (if you use them).
Practical tip: start with the business question (“Do we need more coverage in Queue A this week?”), then set filters and columns. You’ll avoid aimless table scrolling.
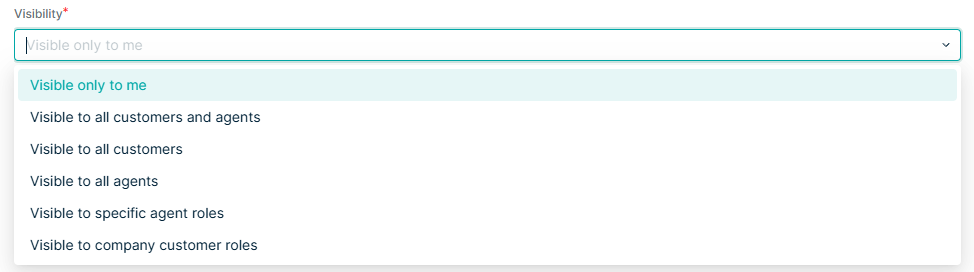
Visibility & security - who sees what (and why)
Not everyone needs to see everything. Mint supports three visibility levels:
Private — only the report author sees it,
Shared — selected people/teams/roles,
Public — available to all system users.
Why it matters:
less noise (teams see only what they need),
lower risk of accidental data exposure,
more accountability (it’s clear who views what and why).
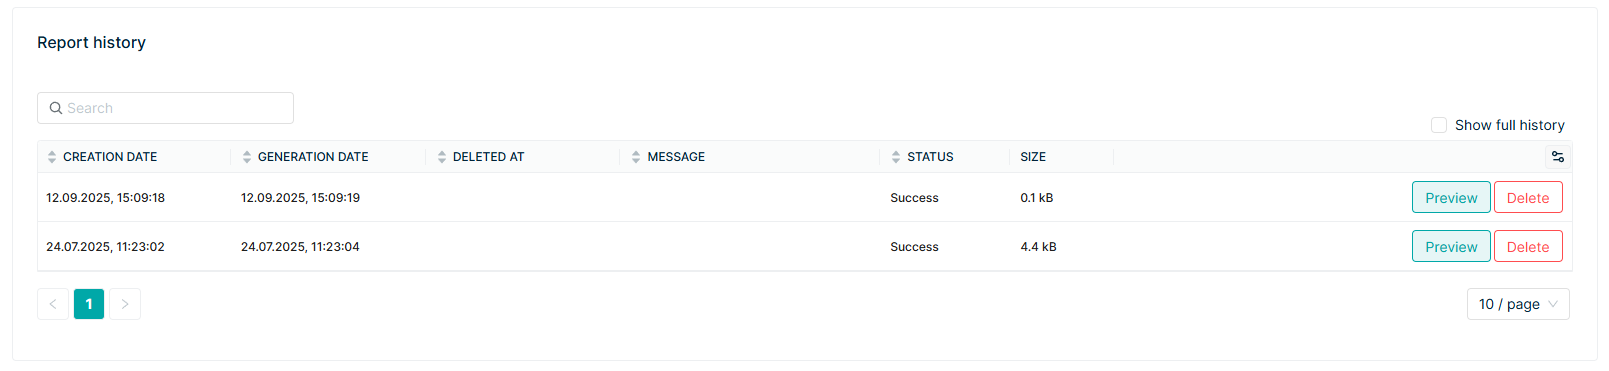
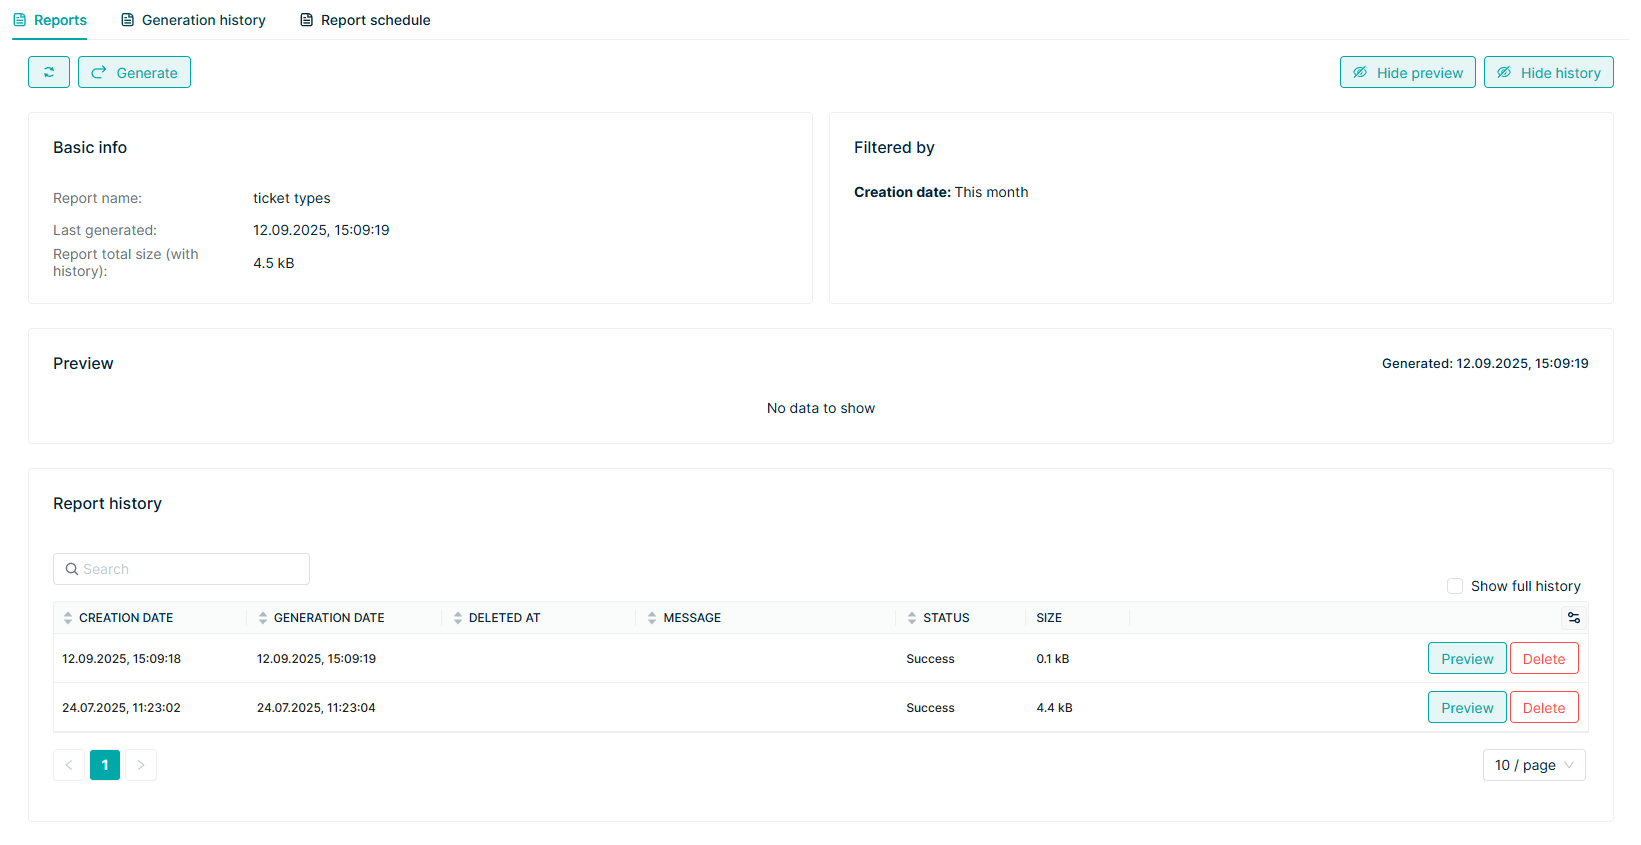
Generation history
Every generated report is stored in the system. That means you can:
Return to previous outputs (e.g., compare March vs. February),
Avoid re-creating configurations — save time,
Line up cyclical results (e.g., month over month).
It’s not a second-by-second timeline of status changes. It’s a practical log of report outputs you chose to generate — with date, parameters, and a ready file to open or send.
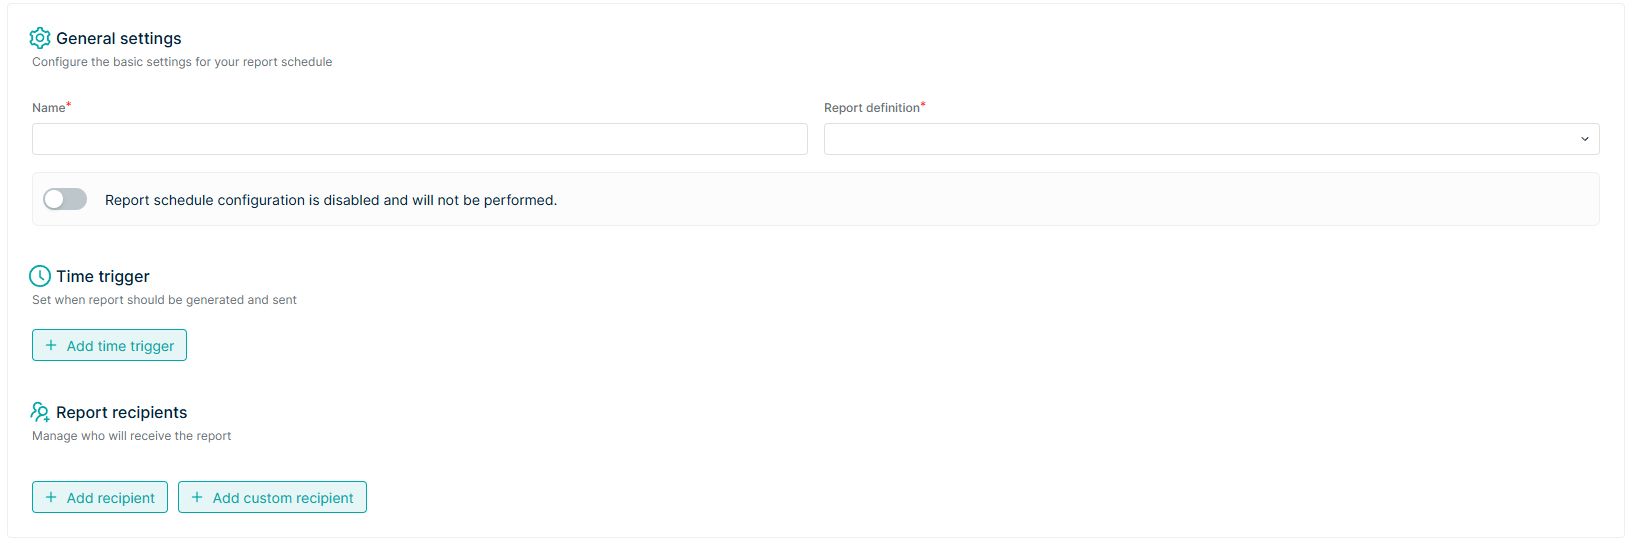
Scheduler - reports that “arrive by themselves”
The scheduler makes reporting run on autopilot:
set frequency (e.g., every Monday at 08:00),
pick recipients (email),
the system generates and sends the report automatically.